Eric Weeks
- personal pages - misc
Polar Flowers
Another very simple idea I got from a book.
See the bottom
of the page for links to other simple algorithms like this one.
|
weeks@physics.emory.edu
|
This idea came from a book called "Mathographics" by Robert Dixon. Simon
Pick gave me this book; thanks, Simon!
Click here for a Java Applet that lets you
play with these ideas interactively. Written by Adriaan
Vannuffel. It's written in Dutch, but just try typing in
numbers and see what happens.
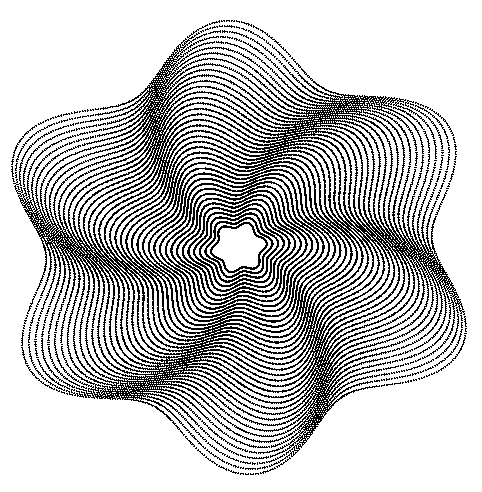
This was created with the following gawk script:
gawk '
BEGIN {
for (rad = 5;rad<45;rad++) {
for (theta=0;theta<=2.0*3.14159265;theta+=0.01) {
r = rad*(8 + sin(theta*6+rad/10));
x = r*cos(theta);
y = r*sin(theta);
print x,y;
}
}
}
' | psdraw -c0.02 -f0 > rose1.ps
I think the gawk script is fairly self-explanatory. The "rad/10" gives the
figure a slight phase shift as it grows larger, resulting in the
spiralling effect. You need to use gawk, not awk, as awk does not have
trigonometric functions. This could all be done very easily in BASIC or
C or whatever.
Other pictures using this idea:
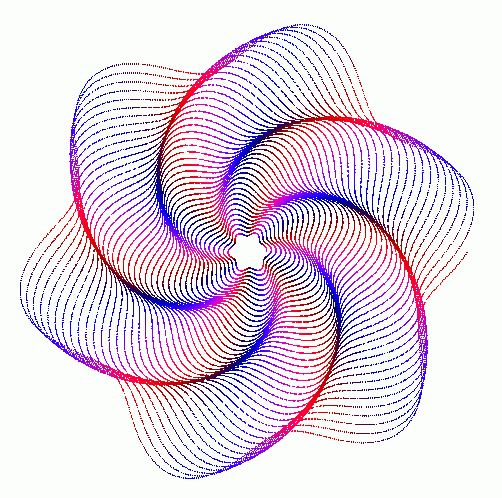
gawk '
BEGIN {
for (theta=0;theta<=45*2*3.14159265;theta+=0.008) {
rad = (0.8*theta/(2*3.14159265)+3);
r = rad*(8 + sin(theta*6+rad/3));
x = r*cos(theta);
y = r*sin(theta);
# this next line sets the COORDINATES:
print x,y;
# this next line sets the COLOR:
print 0.5+0.5*sin(theta*6+rad/12),0,0.5+0.5*cos(theta*6+rad/10)
}
}
' | psdraw -c 0.02 -CO > rose3.ps
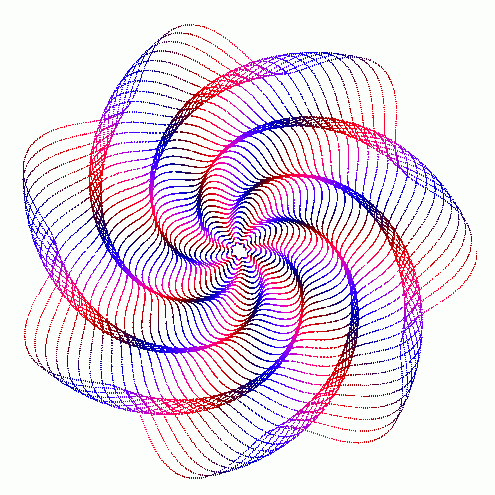
gawk '
BEGIN {
for (theta=0;theta<=45*2*3.14159265;theta+=0.008) {
rad = (0.8*theta/(2*3.14159265)+1);
r = rad*(8 + sin(theta*7+rad/1.8));
x = r*cos(theta);
y = r*sin(theta);
# this next line sets the COORDINATES:
print x,y;
# this next line sets the COLOR:
print 0.5+0.5*sin(theta*7+rad/12),0,0.5+0.5*cos(theta*7+rad/10)
}
}
' | psdraw -c 0.02 -CO > rose4.ps
Click here to get a copy of the above shell script.
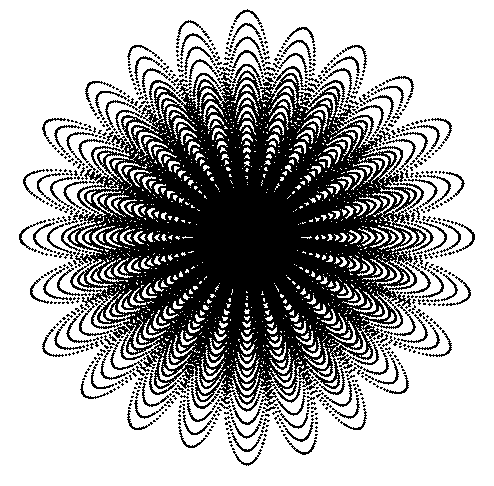
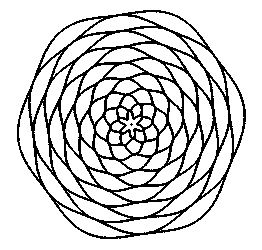
gawk '
BEGIN {
for (rad = 10;rad<60;rad++) {
for (theta=0;theta<=2.0*3.14159265;theta+=0.007) {
r = 8+rad*(0 + sin(theta*6+rad*3.14159265/2));
x = r*cos(theta);
y = r*sin(theta);
print x,y;
}
}
}' | psdraw -c 0.04 -f 0 > rose7.ps
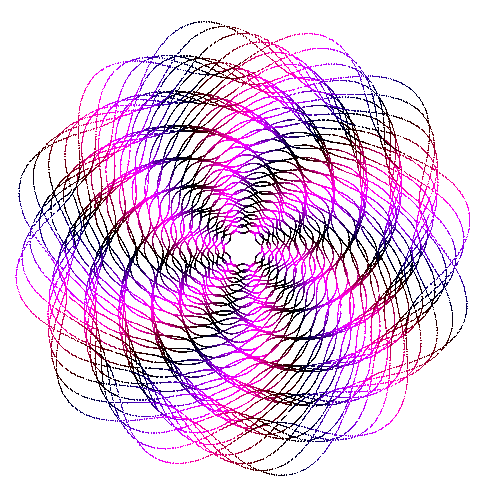
gawk '
BEGIN {
for (rad = 5;rad<60;rad++) {
for (theta=0;theta<=2.0*3.14159265;theta+=0.007) {
r = rad*(8 + sin(theta*6+rad*3.14159265*.9));
x = r*cos(theta);
y = r*sin(theta);
print x,y;
print 0.5+0.5*cos(theta*6+rad/12),0,0.5+0.5*cos(theta*6+rad/10)
}
}
}' | psdraw -c 0.02 -CO > rose8.ps
gawk '
BEGIN {
for (rad = 5;rad<60;rad+=4) {
for (theta=0;theta<=2.0*3.14159265;theta+=0.007) {
r = rad*8 + (16*sin(theta*6+rad*3.14159265/4));
x = r*cos(theta);
y = r*sin(theta);
print x,y;
}
}
}' | psdraw -c 0.08 -f 0 > rose9.ps
Click here for more information on psdraw.
Click here to learn how to convert PostScript to GIF.

Links...
- Odds and Ends:
These are various tiny ideas that are simple to do which
make interesting pictures, or are otherwise interesting (to me).
Click one of the pictures below to see others.


Simple trigonometric plot |
Double-trigonometric contour plot |
Lissajous figures |
Simple diffusion limited aggregation |
Spiral triangles |
Polar flowers
This page created September 4, 1996.
Current address:
Eric R. Weeks
weeks@physics.emory.edu
Department of Physics
Emory University
Atlanta, GA 30322-2430


![]()


