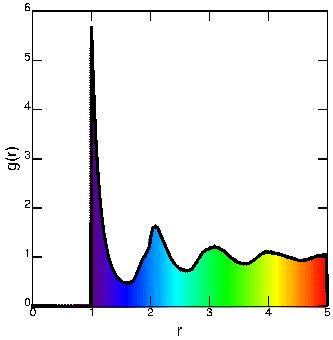

This is related to the probability of finding the center of a particle a given distance from the center of another particle.
For short distances, this is related to how the particles are packed together. For example, consider hard spheres (like marbles). The spheres can't overlap, so the closest distance two centers can be is equal to the diameter of the spheres. However, several spheres can be touching one sphere; then a few more can form a layer around them, and so on.
Further away, these layers get more diffuse, and so for large distances, the probability of finding two spheres with a given separation is essentially constant. In that case, it's related to the density -- a more dense system has more spheres, thus it's more likely to find two of them with a given distance.
The pair correlation function g(r) accounts for these factors by normalizing by the density; thus at large values of r it goes to 1, uniform probability.

|

|
The right picture above shows g(r) calculated for a simple simulation of two-dimensional disks. The function is calculated based on all pairs of particles, but to make it clear I've highlighted one reference particle (black) in the left picture. The surrounding particles are colored based on their distance from the black particle, and correspond to the graph of g(r) on the right. Thus for example about 5 particles are colored purple, and correspond to the prominent peak at a separation of 1 diameter. A couple particles are dark blue, corresponding to the less-likely position about 1.5 diameters away. Several more particles are light blue, corresponding to the 2nd nearest neighbor peak at about 2 diameters. Further away, the green particles form the third nearest neighbors, and the yellow particles form the fourth nearest neighbors.
Note of course that this is all a little ambiguous; actually the colors shade continuously just as the distances between particles shade continuously. Nonetheless, there is a lot of structure here that results in the characteristic shape of g(r). All of the particles farther away are colored red, and you can see that g(r) tends toward a uniform value of 1 for large values of r. (Note that this happens even though the number of particles you're finding gets larger, for example, consider the yellow particles in the picture.)